R is a free software environment for statistical computing and graphics. More information on R is available here.
I started using R recently as an alternative to both SPSS and Excel. I am finding that the tasks for which I used SPSS can be carried out in R and the presentation of information is superior to both SPSS and Excel.
If anyone is using R, please contact me as I am interested in working collaboratively with other colleagues at BU.
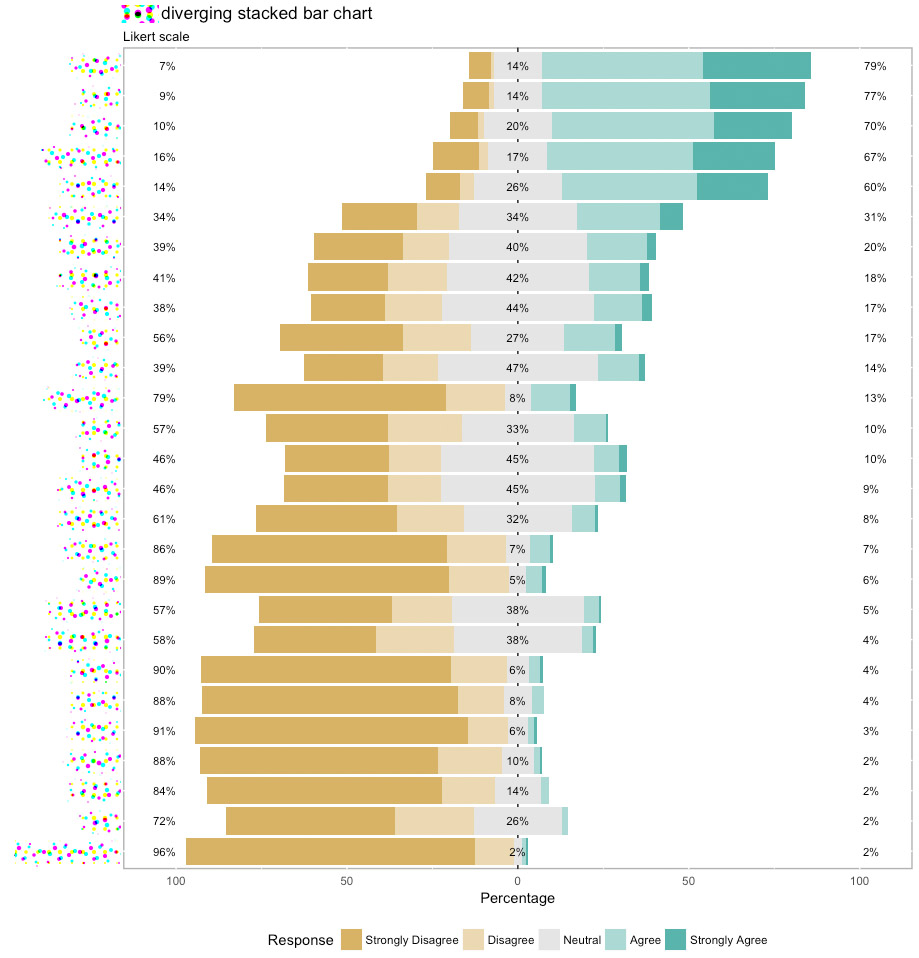
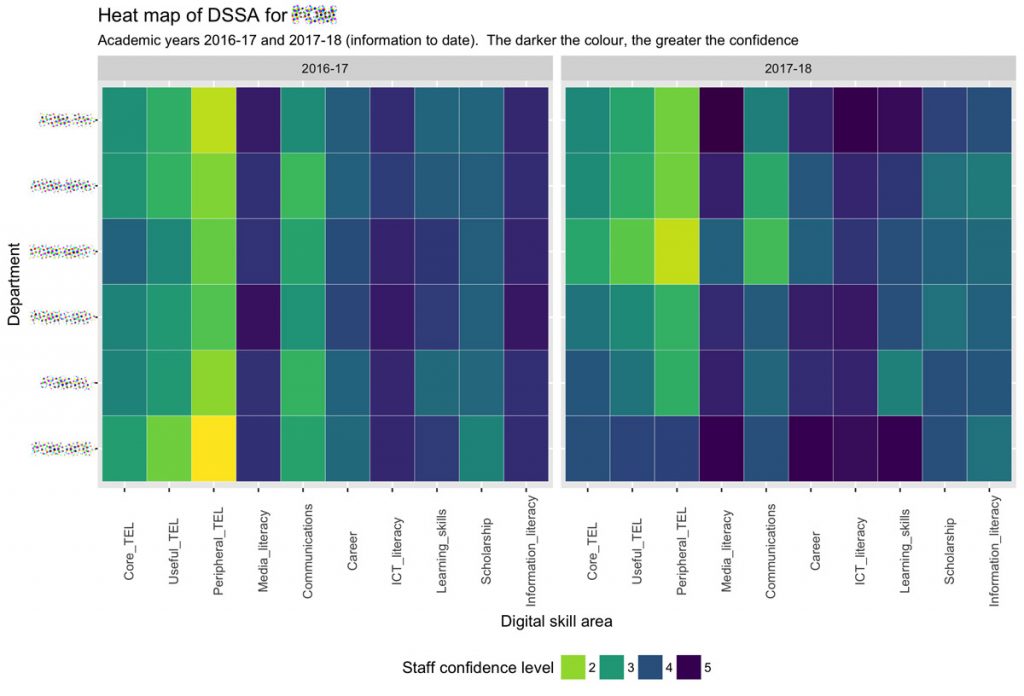
Here are three examples of R’s graphical capability; a Likert chart, heatmap and direction chart.


Try: https://www.displayr.com/ (10 hours free) as it provides analysis using R but with a simple GUI.
Hello, really interested in using this for my data analysis this Autumn. will you be running any workshops for PGRs at all please?