A report issued on 8 March 2018 from the Higher Education Statistics Agency showed that 6.4% of undergraduate students dropped out of higher education during their first year in 2015-16, the third year that this percentage has risen nationally. The percentage for UK domiciled, full-time undergraduate) non-continuing students at BU who entered in 2015/16 is 8.8%, higher than the national average and also the adjusted average that takes into account characteristics such as location and student background.
One of the solutions advanced to reduce withdrawal rates is learning analytics (LA). LA uses historic data about how students interacted with the unit’s content and discussions, as well as their assessment scores to generate predictions for how current students will perform in the same unit. LA builds a model for each unit that analyses the available data to generate the most accurate predictions possible. The more data from past units that is available, the more accurate the predictions. Institutions report predication accuracy rates exceeding 80% after the first year of use.
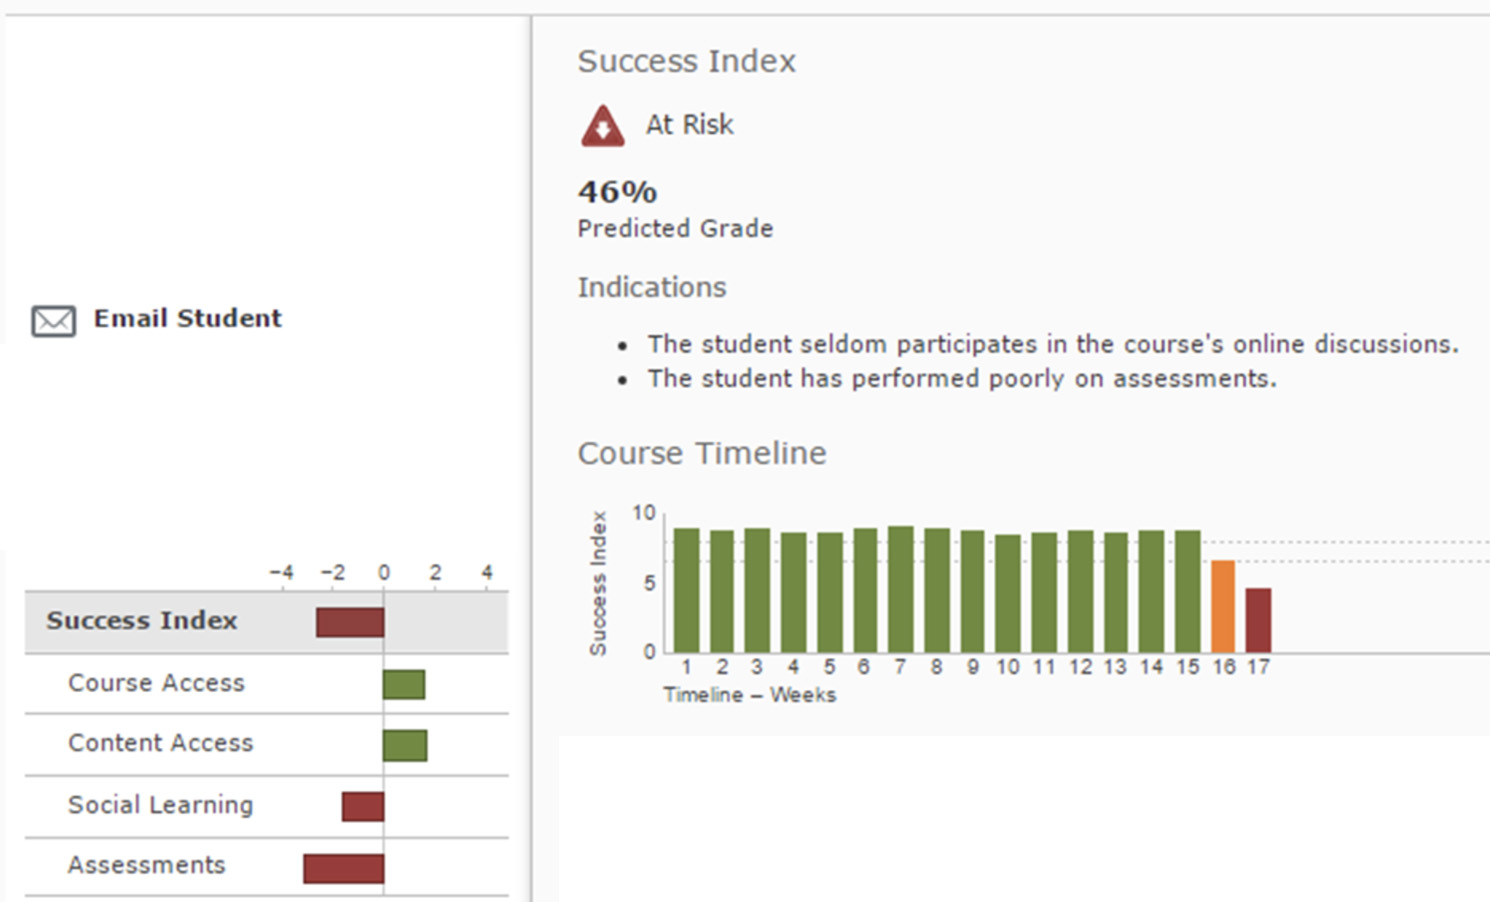
Part of the D2L offering for LA is the Student Success System (SSS). SSS is a unit-level tool that generates a predicted grade for all students on a weekly basis. The screenshot below shows a sample of the output from SSS. From the screen, we can see that this student is identified as being ‘At risk’ because their predicted unit grade at the end of the studies is 46%. In the bottom left hand corner, we can see the basis for the prediction; while access to the VLE has been good and content access has been positive, the student has not participated in discussions (social learning) and the grades received (both formative and summative) are below average. The timeline in the centre of the screenshot shows how this student has been performing well on the unit up until week 15 with lots of green bars, at which point something changed because the student’s performance was flagged as amber in week 16 and red (at risk) in week 17.
This information, which is available to the tutor only, could be used as the basis of an interaction between student and tutor to understand what has recently changed. A drop-off in performance may be the prelude to a withdrawal by the student. While this student has been flagged as being at risk, SSS is generating predictions for all students on the unit. Another potential use of this information would be to identify students near grade boundaries, say 59% or 61%, so that the student can be made aware of their predicted outcome and respond accordingly if they wish. Support for this use of LA data comes from Purdue University in Indiana who identified that students do not have a clear understanding of their progress on their unit – often not until they receive their final grade. Lastly, a drop-off in engagement or discussions may also suggest that students are having difficulty with learning topics or do not see how discussion benefits their learning, signals they may be becoming dissatisfied with the unit.
Authors such as Sclater (2017) sound a note of caution regarding LA, highlighting the potential challenges:
- Units need to make good use of the tools in the VLE to provide a base of data for analysis
- Only a part of student learning takes place within the VLE and this is not captured in LA
- A student accessing the VLE or looking at content (both flagged as green in the screenshot above) does not actually mean that learning is taking place
- LA provides a predicted outcome and there are many factors outside the VLE and BU’s control that can impact on individual student performance
The challenges notwithstanding, LA provides potentially really useful information for both the tutor and student but what exactly is the problem or issue that LA is helping to solve? In the blog post from January, Unlocking the power of data, it was suggested that learning analytics has 3 main purposes; 1. attainment, 2. retention and 3. satisfaction, all of which have been highlighted in the previous paragraph.
Reporting from the annual Learning Analytics and Knowledge conferences organised by the Society for Learning Analytics Research (SoLAR), Ferguson and Clow (2017) suggest that LA is most successful when it has a clear purpose or purposes in the organisation. They conclude:
We found strong agreement among the experts that the best path to avoiding failure when implementing learning analytics is to have a clearly understood purpose. It is not sufficient to introduce learning analytics in the hope that they will lead to improvements – everyone involved needs to know why analytics are being introduced and what they are intended to achieve.
References and acknowledgements:
Ferguson, R. and Clow, D., 2017. Learning Analytics: Avoiding Failure. Educause Review Online, 31. Available at: http://oro.open.ac.uk/50385/3/50385.pdf
Sclater, N., 2017. Learning analytics explained. Taylor & Francis. Available at BU.
SSS image courtesy of D2L


