If you missed the recent webinar on Using Mentimeter for formative assessment, don’t worry – you can catch up on the recording here:
Here are some of the highlights that were demonstrated during the session:
Compare historical data and trends on your slides
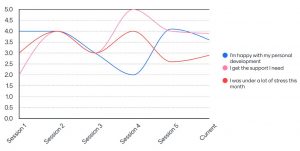
 By resetting the results on a presentation, or a specific slide, you can easily view changes in responses over time. For example, you might want to gauge particular knowledge at the beginning, middle and end of a unit. By using the ‘History’ function you can see how responses have developed. Mentimeter can even display a graph depicting the trends in results (available for Multiple Choice and Scales slides)
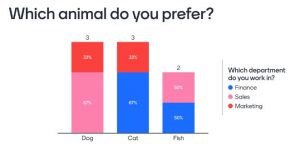
Segmenting results based on previous answers
 If you have more than one Multiple Choice question slide in your Mentimeter presentation, you can set up the segmentation feature when you build your presentation. This feature allows you to present results based on your audience’s response to a previous question. Segmentation only works on Multiple Choice questions with responses restricted to one option.
Further help and guidance
See historical data with sessions and trends
Using Mentimeter for formative assessment – recording
or contact your Faculty Learning Technologist.


