The below sections contain a brief description for the biodiversity monitoring methods for each individual 20 x 20 m plot. Each method was used in all plots along the gradient of collapse.
Identification of each species was carried out by an expert botanist using a detailed field guide book and hand lens. For any species that could not be identified in the field, a small sample was taken and observed in detail later on. The results were recorded on a checklist that consisted of many species. Additional species that were found were added to the list. Each species was marked if present and an estimate of its ground cover within the plot was recorded. These data were recorded between July and September 2014 so that a majority of the flora were flowering.
- Ground flora richness
A comprehensive search of each plot was undertaken. This involved careful observation of the entirety of each plot while slowly moving from side to side within the plot. Extra care was taken where the vegetation was tall and/ or dense (i.e. conditions that made observations trickier) to ensure that all flora was accounted for. Figure 1 shows examples of ground flora.
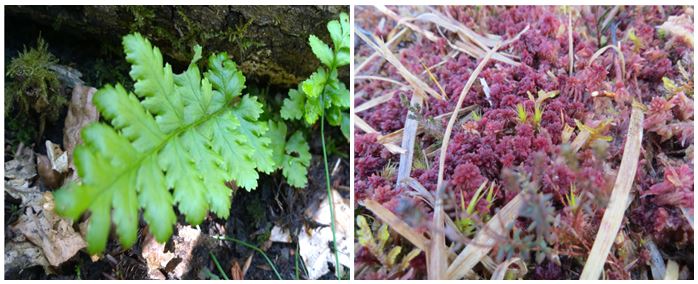
Figure 1: Ground flora, a variety of ferns and mosses are found in the New Forest.
2. Tree, sapling and seedling richness
Each individual tree was recorded in terms of its species if it was taller than 1.3 metres and greater than 0.1 metres in diameter at breast height (DBH). Sapling richness (height: 0.5 > x < 1.3 metres; DBH: < 0.1 metres) was recorded in the same way. Seedling richness (height: < 0.5 metres) and seedling quantity of each different woody species was recorded using a detailed ground scan of the whole plot. These data were recorded between July and September 2014. Figure 2 shows examples of tree species found in the New Forest.
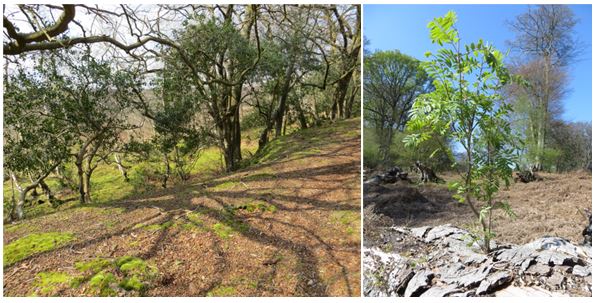
Figure 2: Tree richness, examples of trees and saplings found in the New Forest.
3. Fungi richness
Monitoring data for mycorrhizal fungi, fungi that grows in association with the roots of plants, were recorded using the same technique as for the ground flora (i.e. detailed search of the plot). Each species was recorded if it was present. These data were recorded by an expert between October and November 2014 so that fungi were present. Figure 3 shows examples of mycorrhizal fungi.
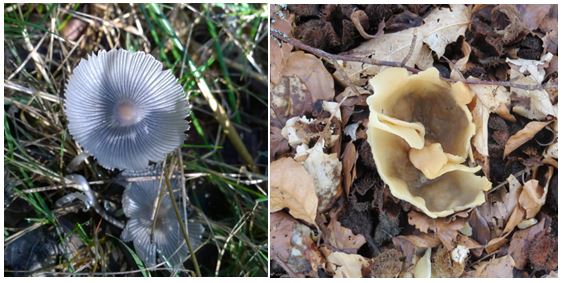
Figure 3: Fungi richness, examples of mycorrhizal fungi found in the New Forest
4. Lichen richness
Lichen species were recorded up to 2 metres in height on each living tree within the plot. Additionally, the bottom 2 metres (upwards from the top of the root plate) of each recently fallen tree were recorded. Recently fallen trees were identified visual having all branches and bark still intact. The lichen richness of each individual tree was recorded resulting from a detailed search by an expert lichenologist. This allowed the richness of all individual trees, individual tree species and the whole plot to be calculated using a sorting method. These data were recorded in April 2015. Figure 4 shows example of lichen found in the New Forest.
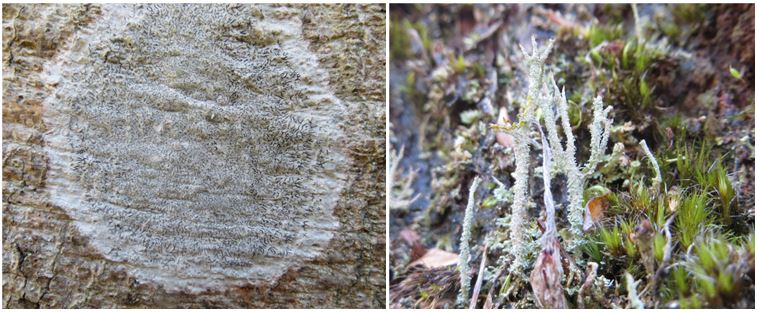 Figure 4: Lichen richness:, lichen found in the New Forest: Phaeographis dendritica (left)
and Cladonia squamosa var. sub squamosa (right).
5. Insect richness
Invertebrate richness monitoring was carried by Forest Research in five out of the 12 sites. Based around the centre of each plot, orientated in the same direction as the plot, a subplot of 10 x 10 metres was created. Pitfall traps were placed on the perimeter of the subplot, one on each corner and side and one in the centre. Species were identified by both metabarcoding and morphological methods. The traps were collected regularly, resulting in eight collections from in May to July 2014.
6. Pathogen presence
An aspect of biodiversity that is concerning is that of tree pathogens. All trees in a plot, both dead and alive, were searched for signs of pathogens. All signs were noted. Some signs of pathogens are shown in Figure 5.
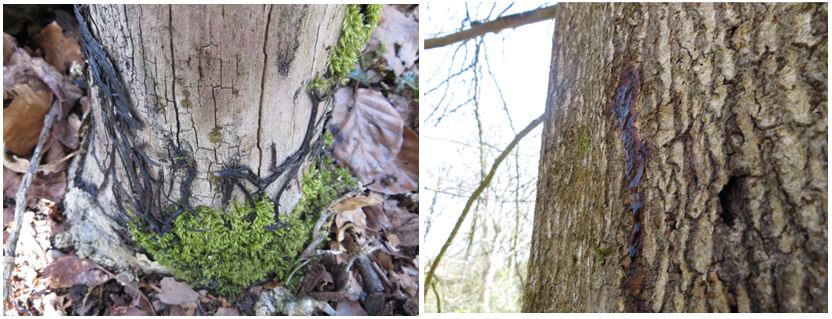
Figure 5: Pathogen signs, ‘Bootstraps’ of the Armillaria genus (black in the left image)
and bleeding canker of Phytophthora genus (right).
Other species present in the New Forest are shown in Figures 6 and 7.
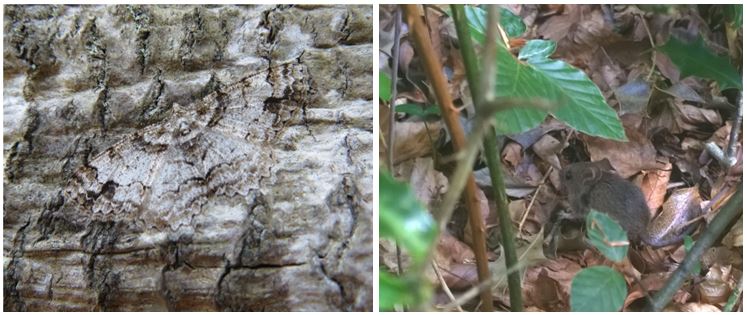
Figure 6: Examples of the biodiversity of the New Forest, least black arches moth, Nola confusalis (left), wood mouse, Apodemus sylvaticus (top right)
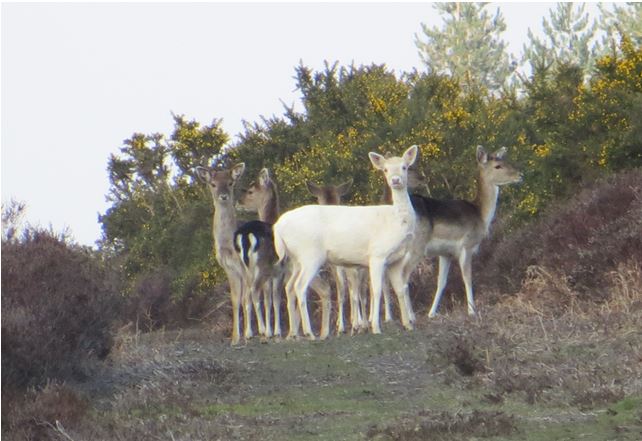
Figure 7: An example of larger wildlife, a fallow deer, Dama dama.