 The EU has released its 7th edition of the Regional Innovation Scoreboard (RIS) that provides a comparative assessment and maps innovation performance across over 200 regions of Europe. It also explores tertiary education attainment and research and development expenditure which are function of innovation performance.
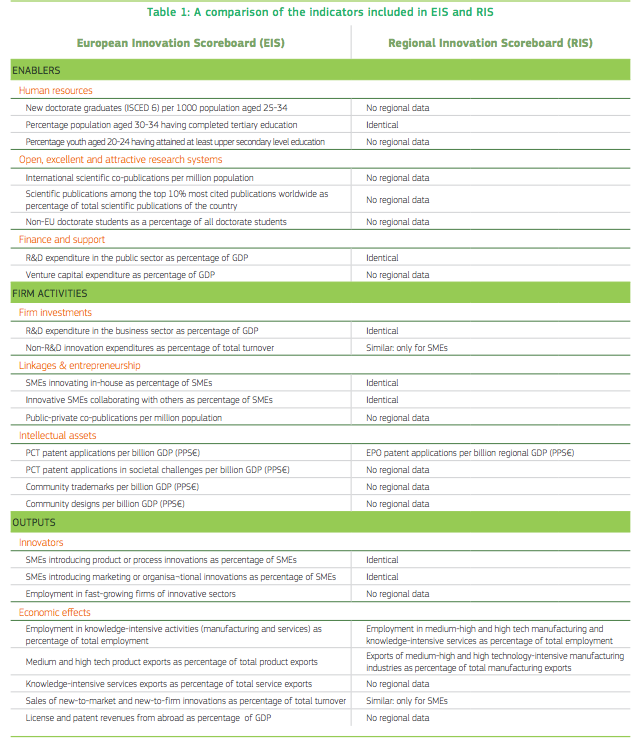
The RIS complements the European Innovation Scoreboard (EIS), which is an annual benchmark by European Member States and focuses less on SMEs.
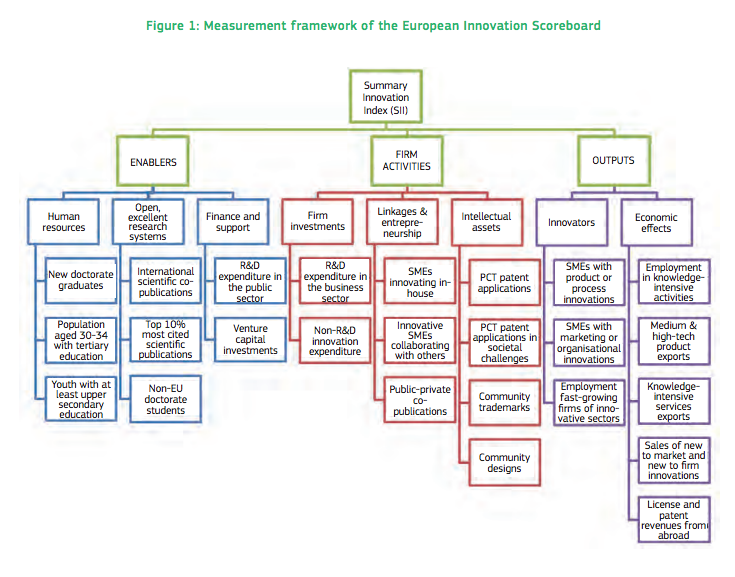
The RIS uses 12 indicators from the 25 indicators used in the EIS, which are grouped into Enablers, Firm Activities and Outputs.
The report states that:
“Economic literature has identified three stylized facts: 1) innovation is not uniformly distributed across regions, 2) innovation tends to be spatially concentrated over time, and 3) even regions with similar innovation capacity have different economic growth patterns. However, attempts to monitor RSIs [Regional Systems of Innovation] and regions’ innovation performance are severely hindered by a lack of regional innovation data.”
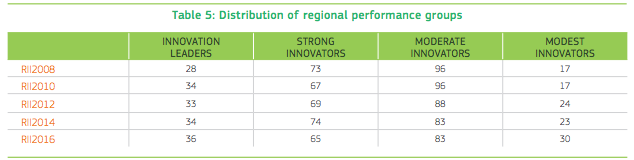
The report indicates that there is limited variation in regional performance groups, which may suggest that regional and national innovation performance are linked, with most regions falling in either Strong or Moderate Innovator categories.
However, at the same time, the analysis does highlight regional ‘pockets of excellence’, – or hubs of innovation – which follows strong variations nationally between regions.

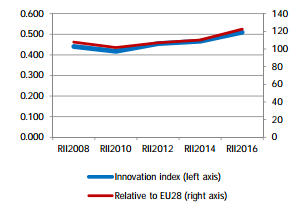
As the RIS is an ongoing analysis over a nine year period, it is able to see how innovation has changed over the years. It reveals that while performance growth has improved across the regions, more recently performance has been in decline: ‘This recent decline in innovation performance is mainly due to a weakening in four indicators using data on SMEs from the Community Innovation Survey 2012: shares of SMEs innovating in-house, SMEs collaborating with others, SMEs with product or process innovations, and SMEs with marketing or organisational innovations.’
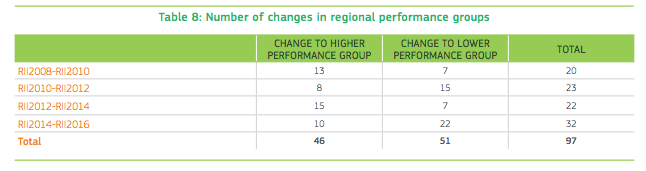
The number of changes in regional performance groups show that some regions have excelled or dropped within the performance group scale.
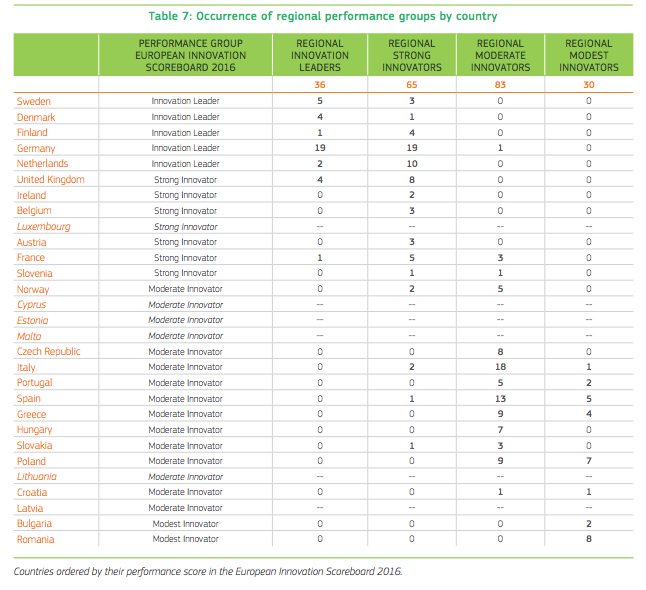
The main finding that the most innovative regions are also located in countries that are already considered as the most innovative may not sound particularly surprising, but it shows how divided Europe has become — with some countries lagging far behind others. ‘Between the most recent periods, there has been a significant increase in changes in performance group membership with more than two-thirds of these changes to a lower performance group.’

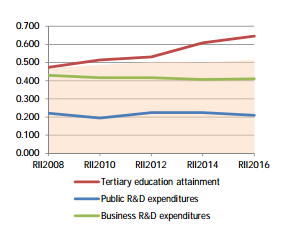
The report also explores tertiary education attainment across regions, which highlights the irregularity across Europe.

Research and Development expenditure in the public sector is also captured across the continent. The top ten leading regions which scored highest are: Nordjylland, Dresden, Braunschweig, Berlin, Trøndelag, Övre Norrland, Köln, Leipzig, Bremen, and Praha.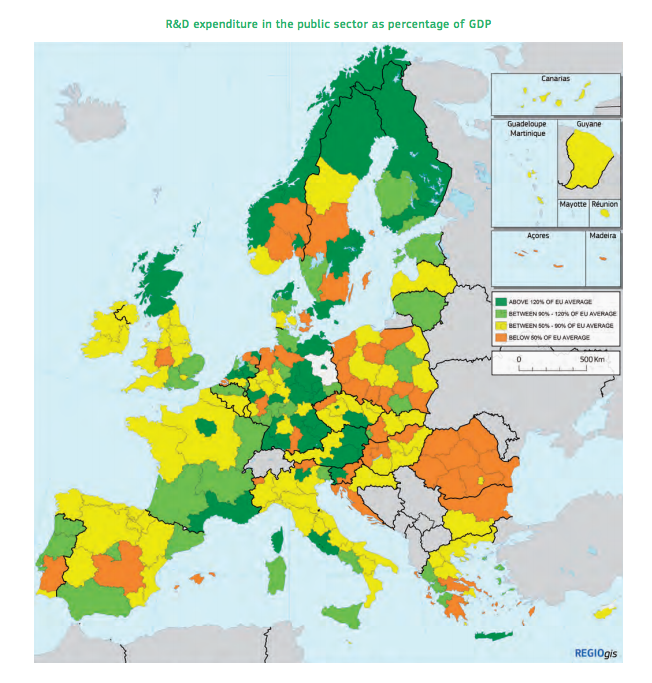
As for Research and Development expenditure in the business sector, the leading regions are: Stuttgart, Braunschweig, Tübingen, Hovedstaden, Oberbayern, Südösterreich, Stockholm, East of England, Västsverige, and Etelä- Suomi.

In the UK, London is seen as an Innovation Leader, and performance has increased by 9% from two years ago.
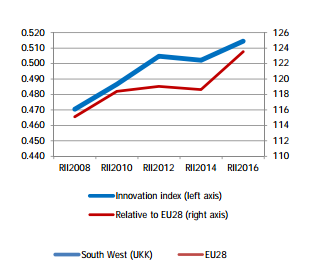
The Southwest region is also seen as an Innovation Leader, and has increased by 2% over the past two years.
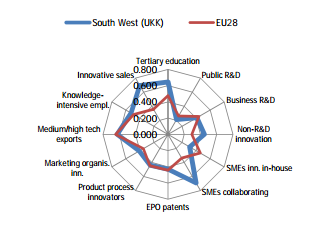
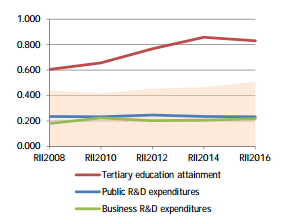
‘The radar graph shows that relative strengths compared to the EU28 are in Innovative SMEs collaborating with others, Sales of new product innovations, and Non-R&D innovation expenditures. The trend graphs on the right show that the relative strengths in the regional innovation system (i.e. the indicators which are most above the shaded area showing the region’s Regional Innovation Index) are Sales of new product innovations, Innovative SMEs collaborating with others, and Tertiary education attainment. Relative weaknesses are in Public R&D expenditures, SMEs innovating in-house, and SMEs with marketing or organisational innovations.’